Welcome to GeoKrige

What is GeoKrige?
GeoKrige is a Python package designed for spatial interpolation using Kriging Methods. While primarily tailored for geospatial analysis, it is equally applicable to other spatial analysis tasks.
GeoKrige simplifies kriging interpolation, offering an intuitive interface akin to the SciKit-learn package.
Key Features of GeoKrige
- Seamless integration with the
GeoPandasandrasteriopackages - Generation of interpolated mesh grids aligned with the boundaries of provided shapefiles (ideal for creating interpolation maps)
- Evaluation tool for created kriging models
- Support for multidimensional interpolation (Multidimensional Kriging)
- Several default variogram models, flexibility for users to define custom models
GeoKrige in Three Steps
Prepare data
import numpy as np

m = np.array([14.5, 15.5, 17.5, 20.5, 23.2, 22])
n = np.array([50.2, 51.7, 52.3, 54.5, 50.5, 53])

X = np.column_stack([m, n])
y = np.array([5, 10, 11, 7, 6.5, 9])
Prepare a model
from geokrige.methods import SimpleKriging

kgn = SimpleKriging()
kgn.load(X, y)

kgn.variogram(bins=6, plot=False)
kgn.fit(plot=False)
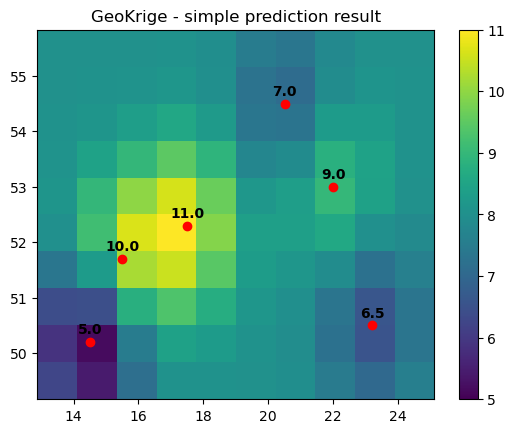
Predict & plot results
import matplotlib.pyplot as plt

# Perform prediction on a mesh grid
lon = np.linspace(13.5, 24.5, 10)
lat = np.linspace(49.5, 55.5, 10)
meshgrid = np.meshgrid(lon, lat)

X, Y = meshgrid
Z = kgn.predict(meshgrid)

# Plot results
plt.scatter(m, n, color='red', zorder=5)
plt.pcolormesh(X, Y, Z, vmin=5, vmax=11)
plt.colorbar()

for i, value in enumerate(y):
    x_pos = m[i]
    y_pos = n[i]
    plt.text(x_pos, y_pos + 0.15, value, ha='center', fontweight='bold')

plt.title("GeoKrige - simple prediction result")
plt.show()